
A trio of NASA telescopes, in conjunction with others on the ground, is helping astronomers learn more about the Milky Way's supermassive black hole, captured in the latest remarkable image from the Event Horizon Telescope (EHT). The Chandra X-ray Observatory, Nuclear Spectroscopic Telescope Array (NuSTAR), and the Neil Gehrels Swift Observatory (Swift) all observe X-rays from their positions in Earth orbit. X-rays pass through much of the gas and dust that blocks the optical view of the center of the Galaxy some 27,000 light years from Earth.
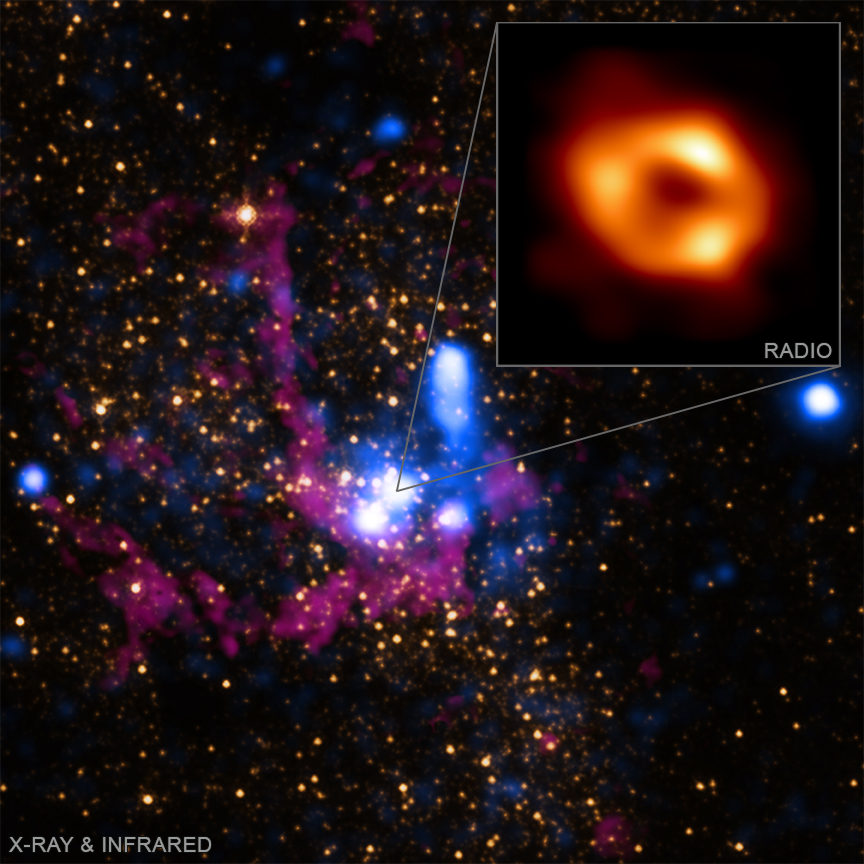
The new EHT image of the Milky Way's central black hole — known as Sagittarius A* (abbreviated as Sgr A*) shows the area close to the "event horizon," the boundary of a black hole from which nothing can escape. The image is based on data obtained in April 2017. As reported in our latest release, simultaneous observations with Chandra, Swift and NuSTAR reveal what is happening farther out, where the gravitational forces from Sgr A* impact the surroundings.
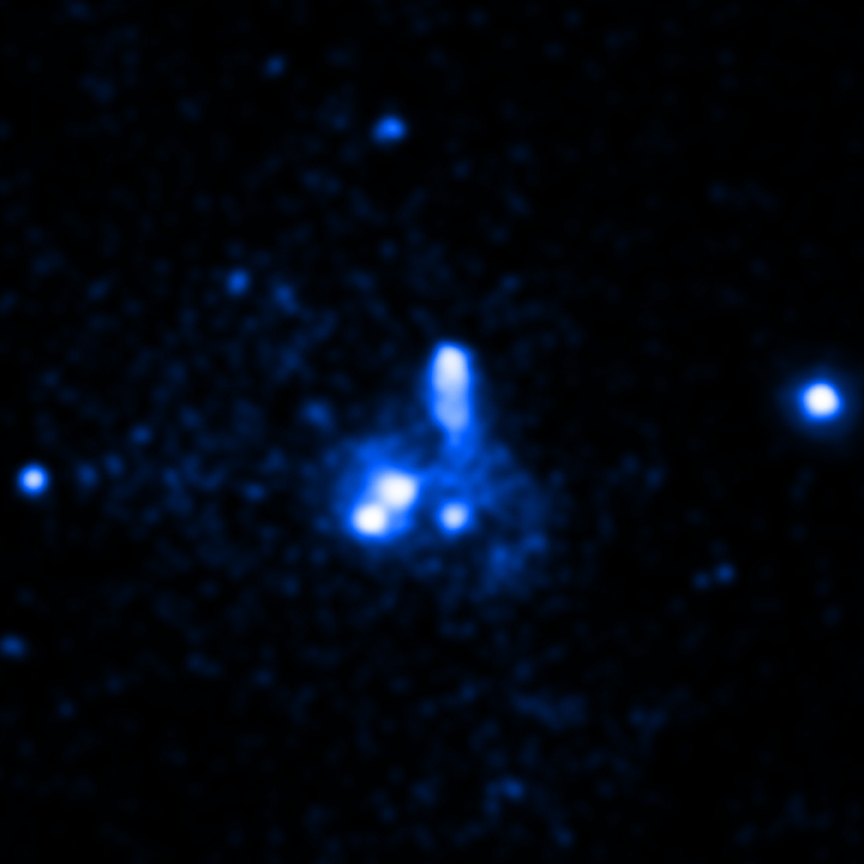
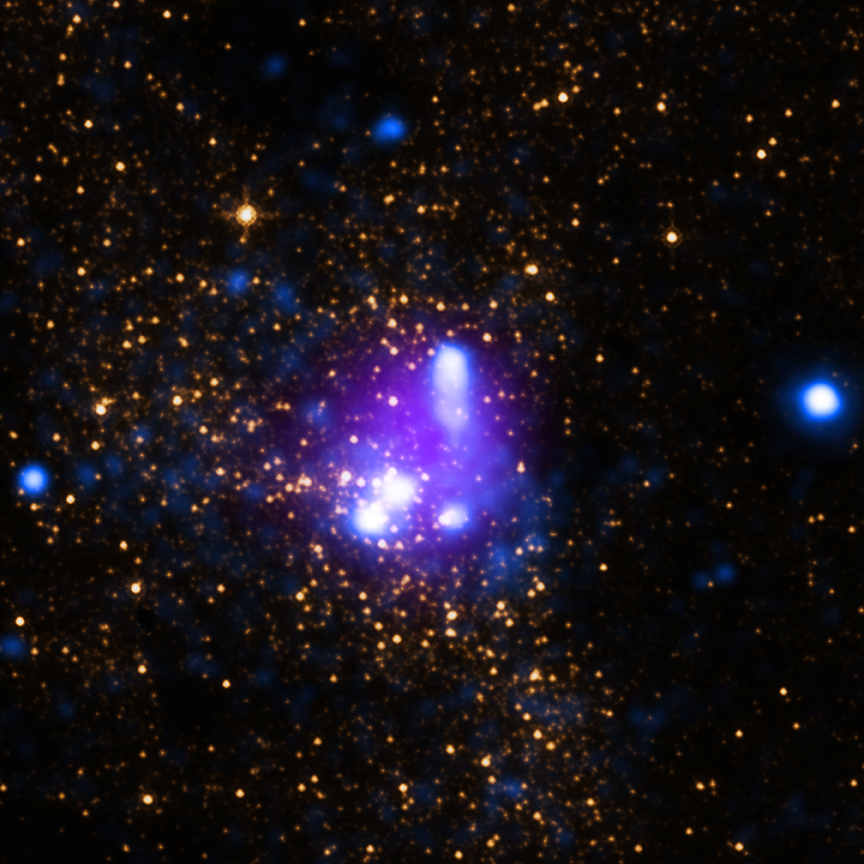
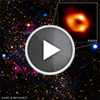
The main panel of this graphic contains X-ray data from Chandra (blue) depicting hot gas that was blown away from massive stars near the black hole. Two images of infrared light at different wavelengths from NASA's Hubble Space Telescope show stars (orange) and cool gas (purple). These images are seven light years across at the distance of Sgr A*. A pull-out shows the new EHT image, which is only about 1.8 x 10⁻⁵ light years across (0.000018 light years, or about 10 light minutes).
Along with the X-ray data from Chandra, NuSTAR, and Swift, scientists in the EHT's 2017 campaign also obtained radio data from the East Asian very long-baseline Interferometer (VLBI) network and the Global 3 millimeter VLBI array; and infrared data from the European Southern Observatory's Very Large Telescope in Chile.
Scientists in the large international collaboration compared the data from EHT, NASA's high-energy missions and the other telescopes to state-of-the-art computational models that consider factors such as Einstein's general theory of relativity, effects of magnetic fields, and predictions of how much radiation the material around the black hole should generate at different wavelengths. A visualization of one of these computer models is given in an accompanying video, which shows material rotating around, falling towards and being blasted away from the black hole.
The researchers also managed to catch two X-ray flares — or outbursts — from Sgr A* during the EHT observations, a faint one seen with Chandra and Swift, and a moderately bright one seen with Chandra and NuSTAR. The changes in X-ray brightness of Sgr A* over time seen with these three X-ray telescopes are shown in a separate graph, with the two flares highlighted in lightly shaded regions. X-ray flares with a similar intensity to the brighter one are regularly observed with Chandra, but this is the first time that the EHT has been simultaneously observing Sgr A*, offering an extraordinary opportunity to identify the responsible mechanism. The computer model shows bursts of red in the disk of material around Sgr A*, representing hotter gas that is responsible for the X-ray flares.
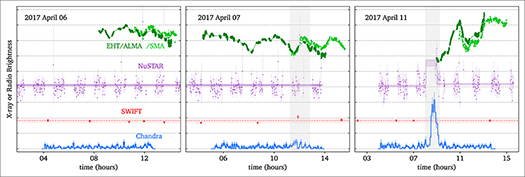
The intensity and variability observed with EHT and two other radio facilities — also visible in the graph — increases in the few hours immediately after the brighter X-ray flare, a phenomenon not seen in radio observations a few days earlier. The analysis of the EHT data immediately following the flare — and its interpretation — have not been included in the new set of papers but will be reported in future publications.
The EHT team's results are being published May 12 in a special issue of The Astrophysical Journal Letters. The multiwavelength results are mainly described in papers II and V.
NASA's Marshall Space Flight Center manages the Chandra program. The Smithsonian Astrophysical Observatory's Chandra X-ray Center controls science operations from Cambridge, Massachusetts, and flight operations from Burlington, Massachusetts.
|
||||||||||||||||||||||||||||||||

