Groups & Clusters of Galaxies
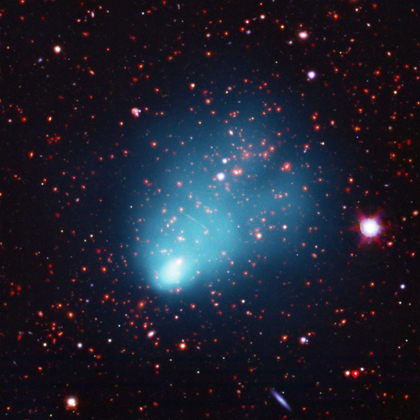
NASA's Chandra Finds Largest Galaxy Cluster in Early Universe
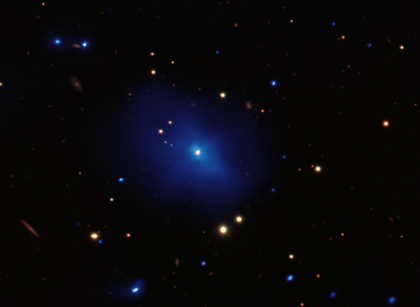
A composite image shows El Gordo in X-ray light from NASA's Chandra X-ray Observatory in blue, along with optical data from the European Southern Observatory's Very Large Telescope (VLT) in red, green, and blue, and infrared emission from the NASA's Spitzer Space Telescope in red and orange.
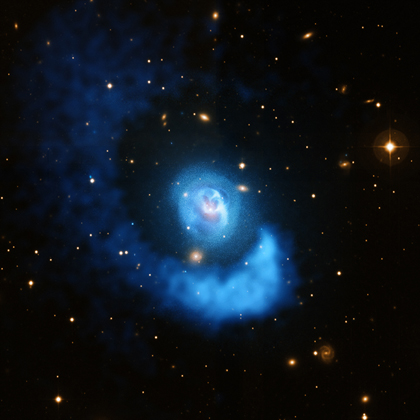
A Galaxy Cluster Gets Sloshed
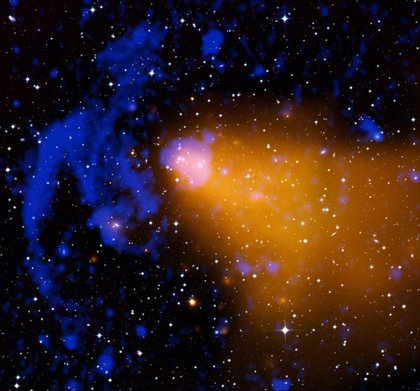
Like wine in a glass, vast clouds of hot gas are sloshing back and forth in Abell 2052, a galaxy cluster located about 480 million light years from Earth. X-ray data (blue) from NASA's Chandra X-ray Observatory shows the hot gas in this dynamic system, and optical data (gold) from the Very Large Telescope shows the galaxies. The hot, X-ray bright gas has an average temperature of about 30 million degrees.
Pandora's Cluster Revealed
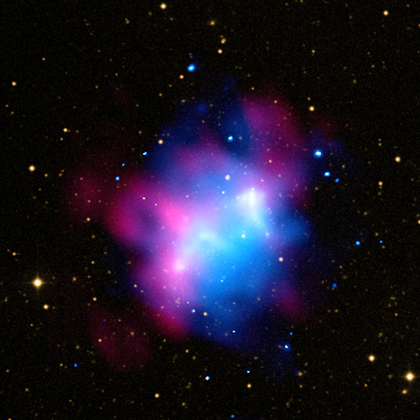
One of the most complicated and dramatic collisions between galaxy clusters ever seen is captured in this new composite image. This collision site, known officially as Abell 2744, has been dubbed "Pandora's Cluster" because of the wide variety of different structures seen. Data from NASA's Chandra X-ray Observatory are colored red, showing gas with temperatures of millions of degrees. In blue is a map showing the total mass concentration (mostly dark matter) based on data from the Hubble Space Telescope (HST), the European Southern Observatory's Very Large Telescope (VLT), and the Japanese Subaru telescope. Optical data from HST and VLT also show the constituent galaxies of the clusters.
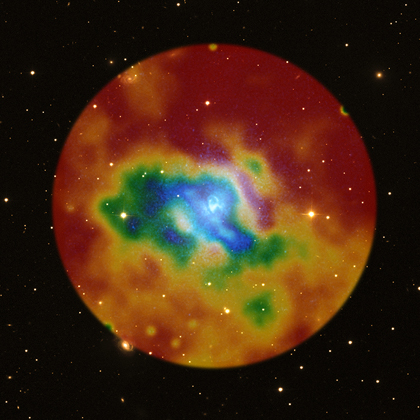
An Intergalactic Weather Map
This composite image shows an intergalactic "weather map" around the elliptical galaxy NGC 5813, the dominant central galaxy in a galaxy group located about 105 million light years away from Earth. Just like a weather map for a local forecast on Earth, the colored circle depicts variations in temperature across a region. This particular map presents the range of temperature in a region of space as observed by NASA's Chandra X-ray Observatory, with the hotter temperatures shown in red and decreasingly cooler temperatures shown in orange, yellow, green, and blue. The numbers displayed when rolling your mouse over the image give the gas temperature in millions of degrees.
Precocious Galaxy Cluster Identified by Chandra
NASA's Chandra X-ray Observatory has observed an unusual galaxy cluster that contains a bright core of relatively cool gas surrounding a quasar called 3C 186. This is the most distant object yet observed, and could provide insight into the triggering of quasars and the growth of galaxy clusters.
Cluster Collisions Switch on Radio Halos
This is a composite image of the northern part of the galaxy cluster Abell 1758, located about 3.2 billion light years from Earth, showing the effects of a collision between two smaller galaxy clusters. Chandra X-ray data (blue) reveals hot gas in the cluster and data from the Giant Metrewave Radio Telescope (GMRT) in India (pink) shows huge "halos" generated by ultra-relativistic particles and magnetic fields over vast scales. Optical data from the Digitized Sky Survey are colored gold.
Shapes All Over The Place: Bubbles
Maybe it's the large number of the pre-school people that we spend time with these days, but we see shapes all over the place. Hoping to go beyond the snack-and-nap crowd, we like to look for similar shapes in very unexpected places.
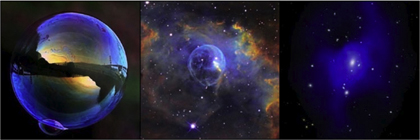
A demonstration of visuals for bubbles (soap bubble, bubble nebula, galaxy cluster bubbles) across different scales.
Einstein's Theory Fights off Challengers
Two different teams have reported using Chandra observations of galaxy clusters to study the properties of gravity on cosmic scales and test Einstein's theory of General Relativity. Such studies are crucial for understanding the evolution of the universe, both in the past and the future, and for probing the nature of dark energy, one of the biggest mysteries in science.
Two Tails to Tell
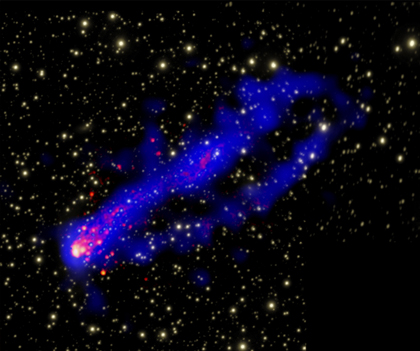
Two spectacular tails of X-ray emission has been seen trailing behind a galaxy using the Chandra X-ray Observatory. A composite image of the galaxy cluster Abell 3627 shows X-rays from Chandra in blue, optical emission in yellow and emission from hydrogen light -- known to astronomers as "H-alpha" -- in red. The optical and H-alpha data were obtained with the Southern Astrophysical Research (SOAR) Telescope in Chile.

