Groups & Clusters of Galaxies
Monster "El Gordo" Galaxy Cluster is Bigger than Thought
This is a composite image of X-rays from Chandra and optical data from Hubble of the galaxy cluster ACT-CL J0102-4915, located about 7 billion light years from Earth. This cluster has been nicknamed "El Gordo" (or, "the fat one" in Spanish) because of its gigantic mass.
Life Is Too Fast, Too Furious for This Runaway Galaxy
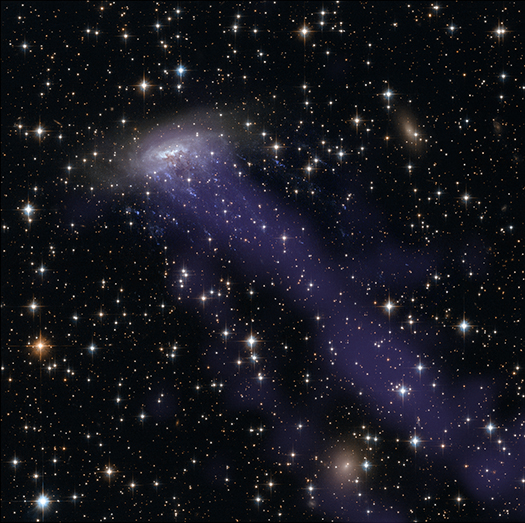
The spiral galaxy ESO 137-001 looks like a dandelion caught in a breeze in this new composite image from the Hubble Space Telescope and the Chandra X-ray Observatory.
The galaxy is zooming toward the upper right of this image, in between other galaxies in the Norma cluster located over 200 million light-years away. The road is harsh: intergalactic gas in the Norma cluster is sparse, but so hot at 180 million degrees Fahrenheit that it glows in X-rays detected by Chandra (blue).
Extreme Power of Black Hole Revealed
Astronomers have used NASA's Chandra X-ray Observatory and a suite of other telescopes to reveal one of the most powerful black holes known. The black hole has created enormous structures in the hot gas surrounding it and prevented trillions of stars from forming.
Clues to the Growth of the Colossus in Coma
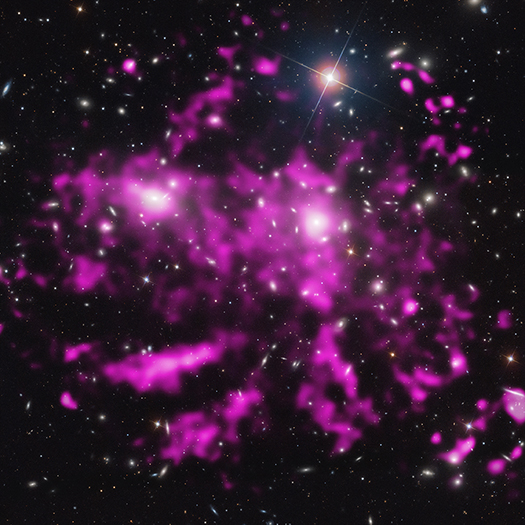
A team of astronomers has discovered enormous arms of hot gas in the Coma cluster of galaxies by using NASA's Chandra X-ray Observatory and ESA's XMM-Newton. These features, which span at least half a million light years, provide insight into how the Coma cluster has grown through mergers of smaller groups and clusters of galaxies to become one of the largest structures in the Universe held together by gravity.
A new composite image, with Chandra data in pink and optical data from the Sloan Digital Sky Survey appearing in white and blue, features these spectacular arms. In this image, the Chandra data have been processed so extra detail can be seen.
Never give up and trust your intuition
We are very pleased to welcome a guest blogger, Julie Hlavacek-Larrondo, who led the work described in our latest press release. Julie was raised in Montreal, Canada, and in 2007 completed a Bachelor’s degree in physics at the University of Montreal. Julie then obtained a Master’s degree in astrophysics. In 2012, she completed a PhD at the University of Cambridge. She is currently an Einstein Fellow at Stanford University.
It was during my Master degree at the University of Montreal that I realized just how fascinating black holes are.
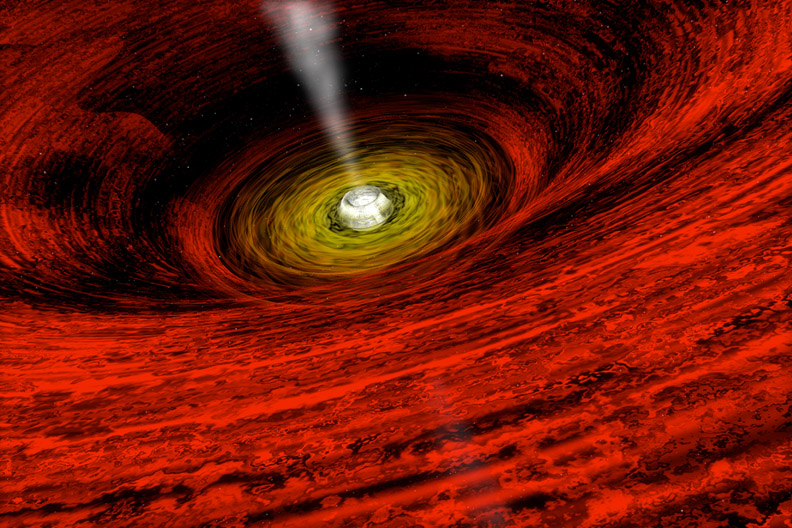
I remember stumbling upon a press release from Chandra in 2007. The Chandra space telescope revealed an image of a jet, powered by a supermassive black hole, blasting through its neighboring galaxy. What's so fascinating? Supermassive black holes are tiny objects, about a billion times smaller than the galaxy it resides in, yet, it can create jets that extend well beyond the size of the galaxy! How can something so small be so powerful?
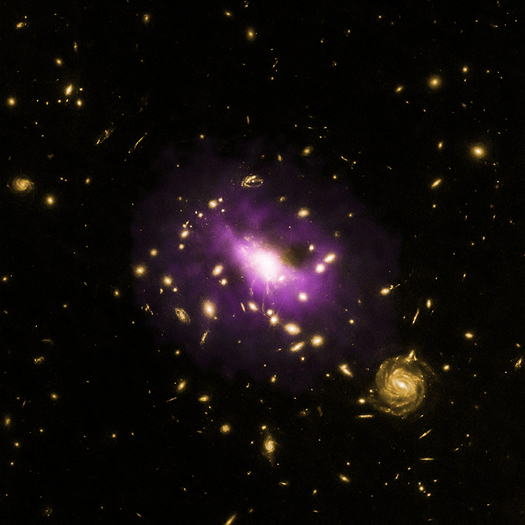
From Super to Ultra: Just How Big Can Black Holes Get?
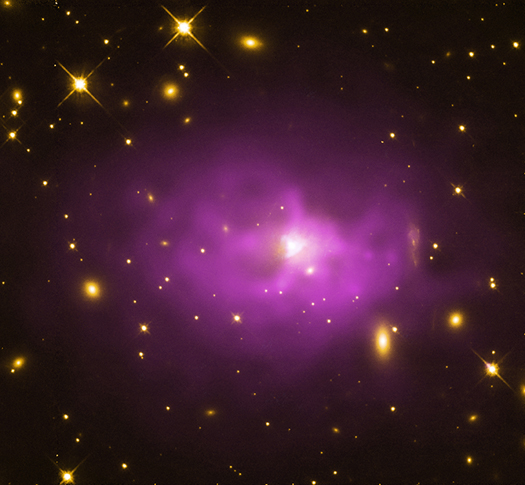
The black hole at the center of this galaxy is part of a survey of 18 of the biggest black holes in the universe. This large elliptical galaxy is in the center of the galaxy cluster PKS 0745-19, which is located about 1.3 billion light years from Earth. X-ray data from NASA's Chandra X-ray Observatory are shown in purple and optical data from the Hubble Space Telescope are in yellow.
Q&A with Michael McDonald

Michael McDonald
Astrophysics and the Olympics
It's not every day that we can mention "Chandra" and the "Olympics" in the same sentence, but today we can. That's because Stacie Powell, who will compete in the 10-meter platform diving competition for Great Britain at the London Olympics beginning today, is also working on her Ph.D. in astrophysics.
An Interview with Will Dawson
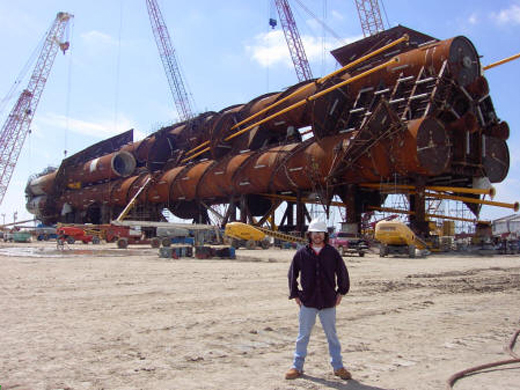 Will Dawson standing next to the Red Hawk cell spar (currently installed in the Gulf of Mexico).
Astronomy can generate a large amount of attention from the public, but the number of working astronomers is smaller than the number of researchers in many other academic fields. So, when people get over their surprise at meeting a real astronomer, they often ask "How did you end up working in this field?". There are many different answers, but an interesting one is provided here by Will Dawson from the University of California, Davis, who kindly explains his career change from engineering to astronomy. We were very satisfied to hear that part of his motivation for this big change came from the publicity generated by the Bullet Cluster in 2006.
Will is the first author of a recent paper describing the discovery of the Musket Ball Cluster.
What field did you work in before astronomy?
After graduating with my bachelor of science degree in Maritime Systems Engineering from Texas A&M at Galveston in 2002, I went to work in the offshore engineering industry at Technip. During my four years with Technip I was primarily involved with the design and analysis of Spars, which are floating offshore oil production platforms (essentially stiffened steel cylinders roughly 90 feet in diameter, 550 feet long and 25,000 tons).
What inspired you to change fields?
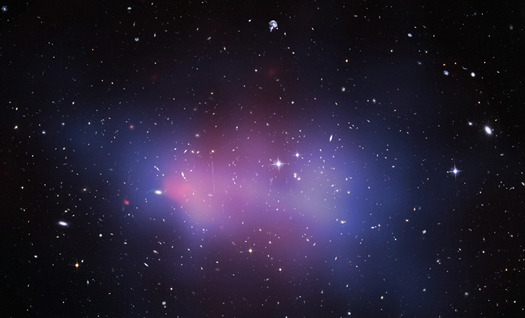
Discovery of the Musket Ball Cluster
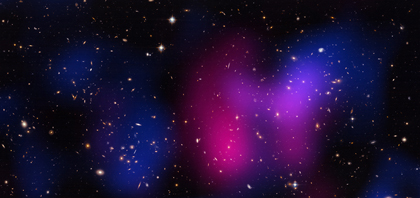
Using a combination of powerful observatories in space and on the ground, astronomers have observed a violent collision between two galaxy clusters in which so-called normal matter has been wrenched apart from dark matter through a violent collision between two galaxy clusters.
The newly discovered galaxy cluster is called DLSCL J0916.2+2951. It is similar to the Bullet Cluster, the first system in which the separation of dark and normal matter was observed, but with some important differences. The newly discovered system has been nicknamed the "Musket Ball Cluster" because the cluster collision is older and slower than the Bullet Cluster.