Eta Carinae: Visualization Explores A Massive Star's Great Eruption
Eta Carinae contains one of the biggest and brightest stars in our Galaxy.
Different telescopes reveal different pieces of information about this system.
A new 3D model of Eta Carinae is based on data from three NASA telescopes.
Chandra, Hubble, and Spitzer data were used for this visualization.
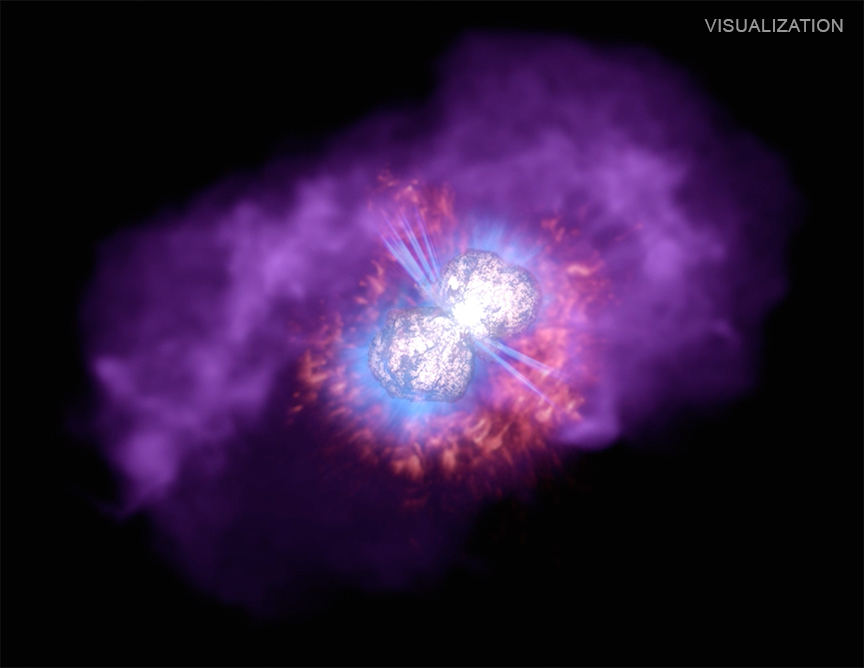
Eta Carinae, or Eta Car, is famous for a brilliant and unusual outburst, called the "Great Eruption", observed in the 1840s. This visualization presents the story of that event and examines the resulting multiwavelength emissions and three-dimensional structures surrounding Eta Car today.
Massive stars are known to have major outbursts. Eta Car, one of the most massive stars known, expelled about 10% of its mass in the Great Eruption, creating a small nebula, called the Homunculus Nebula, around it. Images taken in different wavelengths of light reveal different structures, each providing more information about the outbursts of Eta Car.
For this visualization, astronomers and artists have used NASA observations to model both the close-up and wide views of this massive and eruptive star. The Hubble Space Telescope and the Chandra X-ray Observatory have observed the nested layers of gas and dust around Eta Car using visible, ultraviolet, and X-ray light, as well as in the hydrogen alpha emission line. The Spitzer Space Telescope provides a larger view of the Carina Nebula, along with Eta Car's dominant position within this star-forming region.
Animation: Eta Carinae 2D Images to 3D Models
This visualization is presented by the AstroViz Project of NASA's Universe of Learning. Viewers gain appreciation for how the observations from two centuries ago connect to the resulting structures seen today. Full 360-degree 3D views help to assemble a complete mental model that aids interpretation of the NASA observations. A sonification and a 3D printable model of this data set were also made available. Eta Car serves as a notable example of the outbursts in the dying stages of massive stars.
NASA's Marshall Space Flight Center manages the Chandra program. The Smithsonian Astrophysical Observatory's Chandra X-ray Center controls science operations from Cambridge, Massachusetts, and flight operations from Burlington, Massachusetts.
NASA's Universe of Learning materials are based upon work supported by NASA under cooperative agreement award number NNX16AC65A to the Space Telescope Science Institute, working in partnership with Caltech/IPAC, the Center for Astrophysics | Harvard & Smithsonian, and the Jet Propulsion Laboratory.
Fast Facts for Eta Carinae:
Image Credit
A. Fujii, J. Morse (BoldlyGo Inst), N. Smith (U Arizona), Hubble SM4 ERO Team, NASA, ESA, STScI, JPL-Caltech, CXC, ESO, NOAO, AURA, NSF
Video Credit
J. Olmsted, D. Player, L. Hustak, A. Pagan, J. DePasquale, G. Bacon, F. Summers (STScI), R. Hurt (Caltech/IPAC), NASA, ESA; Music: "Interstellar Wanderer", Joseph DePasquale, CC BY-NC 4.0
Release Date
January 25, 2022
About the Sonification
3D Method for Optical/H/X-ray Layers
The distribution of emitting regions visible in the top-down view is used to control the overall volume and stereo position (so a bright region will be loudest when close to the camera and can be heard moving from left to right)
This is done with a set of 'cloud tracers', the sound generated for each layer is placed at several points around a horizontal ring. The inherent volume of each tracer indicates the brightness in that direction.
Optical
Optical spectrum shifted into human hearing range (40, 41, and 42 octaves lower)
Optical lightcurve fluctuations control the volume (kind of flickering)
Volume and stereo position is modulated by position and depth of emitting regions (louder when closer to viewer/listener)
UV
Map distance from the center to pitch (higher pitches when light is closer to viewer/listener)
The top-down image is sonified, rather than generating a sound using a spectrum and lightcurve (this contrasting sound makes it easier to hear the spokes and also contrasts with the tone of the other 3 layers making it easier to differentiate)
H-alpha
Single frequency (40 octaves below true H alpha frequency), with changes in pitch due to doppler shift of bright regions approaching or receding viewer/listener
Volume and stereo position is modulated by position and depth of emitting regions (louder when closer to viewer/listener)
Single frequency (40 octaves below true H alpha frequency)
Amplitude is modulated with clumps in image
X-ray
X-ray spectrum shifted into human hearing range (49 octaves lower)
X-ray lightcurve fluctuations control the volume
Fluctuations are caused by brightening every 5 years when the binary stars are at their closest (periastron), (there is about 3 cycles per second, so 15 years pass every second)
Volume and stereo position is modulated by position and depth of emitting regions (louder when closer to viewer/listener)
Scale
X-ray component is about 1.1 arcmin (2.4 light years) across.


