Chandra Opens New Line of Investigation on Dark Energy
Chandra images of multimillion degree Celsius gas in galaxy clusters have provided astronomers with a powerful new method to probe the mass and energy content of the universe.A recent study of 26 clusters of galaxies confirms that the expansion of the universe stopped slowing down about 6 billion years ago, and began to accelerate.
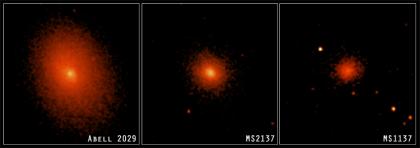
The clusters were carefully chosen for their dynamically relaxed state and because they span a large range of distances, from one billion to eight billion light years from Earth. These Chandra images show 3 of the clusters used in the study - from left to right Abell 2029, MS 2137.3-2353, and MS 1137.5+6624, seen as they looked 1 billion, 3.5 billion, and 6.7 billion years ago, respectively.
A galaxy cluster is comprised on hundreds of galaxies embedded in a cloud of extremely hot gas and dark matter. Dark matter, an invisible and unknown type of material, is postulated to hold clusters together. X-ray observations have the unique ability to determine the ratio of the mass of the hot gas and the mass of the dark matter in a cluster. The observed values of the gas fraction depend on the assumed distance to the cluster.
Because galaxy clusters are the largest bound structures in the Universe, they are thought to represent a fair sample of the matter content in the universe. If so, the ratio of hot gas and dark matter should be the same for every cluster. Using this assumption, the distance scale can be adjusted to determine which one fits the data best. These distances show that the expansion of the Universe was first decelerating and then began to accelerate about six billion years ago.
Many scientists attribute the driving force behind cosmic acceleration to dark energy a strange form of energy that acts like repulsive gravity. It could be due to extra dimensions of space, or possibly it is an indication that modifications of Einstein's theory are needed.
Assuming that dark energy is responsible for the acceleration, combining the Chandra results with observations of the cosmic microwave background radiation indicates that dark energy makes up about 75% of the Universe, dark matter about 21%, and visible matter about 4%. The Chandra observations agree with results from the Hubble Space Telescope (HST) and other optical telescopes, which first showed evidence for an accelerating expansion of the Universe. Chandra's independent verification helps to strengthen the case for cosmic acceleration.
The new Chandra results suggest that the dark energy density may be constant. If so, the Universe would continue expanding forever, with galaxy groups and clusters spreading further and further apart. The Chandra data also allow for the possibility that the dark energy may be increasing slowly with time. In this case, the cosmic acceleration would increase until, at a far distant time, galaxies, stars, planets and even atoms will eventually be torn apart in what has been termed The Big Rip.
|
||||||||||||||||||||||||||||
|
||||||||||||||||||||||||||||
|
||||||||||||||||||||||||||||
These Chandra images show 3 galaxy clusters - from left to right - of Abell 2029, MS 2137.3-2353, and MS 1137.5+6624, seen as they looked 1 billion, 3.5 billion, and 6.7 billion years ago, respectively. The background of the image is black, with textured orange blobs in the centers. These colors represent the intensity of the X-ray emissions from the galaxy clusters, with brighter areas appearing in lighter orange, and dimmer areas in darker orange. The three clusters are a mixture of circular and elongated shapes, with the first cluster at left the largest and most elliptical, and the second two clusters much smaller and more circular. These images of galaxy clusters as well as others not shown were used to study the rate of expansion of the Universe. A galaxy cluster is comprised of hundreds of galaxies embedded in a cloud of extremely hot gas, shown in the X-ray images, and invisible dark matter, which is needed to hold the cluster together. X-ray observations were used to determine the ratio of hot gas to dark matter in the clusters. Because galaxy clusters are assumed to be a fair sample of the matter in the Universe, the ratio of hot gas and dark matter should be the same for every cluster. This assumption can be used to make an independent determination of the distances to the clusters. These distances show that the expansion of the universe stopped slowing down about 6 billion years ago and began to accelerate, indicating that the repulsive effects of dark energy are now dominant.


