Why Make Sonifications of Astronomical Data?
Jingle, Pluck, and Hum: Sounds from Space
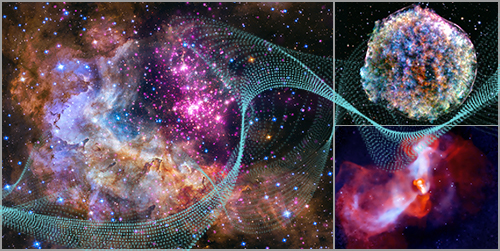
Credit: NASA/CXC/SAO/K.Arcand, SYSTEM Sounds (M. Russo, A. Santaguida)
When you travel to a foreign country where they speak a language you do not understand, it is usually imperative that you find a way to translate what is being communicated to you. In some respects, the same can be said about data collected from objects in space.
A telescope like NASA's Chandra X-ray Observatory captures X-rays, which are invisible to the human eye, from sources across the cosmos. This high-energy light gets sent back down to Earth in the form of ones and zeroes. From there, the data are transformed into a variety of different things — from plots to spectra to images.
This last category — images — is arguably what most telescopes are best known for. For most of astronomy's long history, however, most who are blind or visually impaired (BVI) can often not fully experience the wonders that telescopes have captured.
In recent decades, that has begun to change. There are various ways that astronomers, data scientists, astronomy communication professionals, and others can work with communities of different abilities, from creating 3D prints and visual descriptions to sound-based products. As part of the Chandra X-ray Center and NASA's Universe of Learning, a team of experts led by Dr. Kimberly Arcand has been working to "sonify" (turn into sound) data from some of NASA's greatest telescopes.
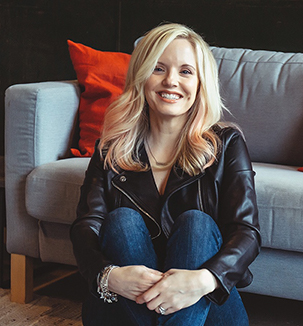
Dr. Kim Arcand
Q: How long have you been making sonifications of astronomical objects?
A: I had started researching sound-based data visualization techniques a few years ago after learning about my colleague and friend Dr. Wanda Diaz's exciting work on sonification and being better listeners in science and astronomy. I also came across the work of the talented Dr. Matt Russo, an astrophysicist and musician from System Sounds, and connected with him at a visualization conference.
At the same time, in my student lab, as part of our ongoing extended reality (XR) program, we had begun experimenting with attaching sound to spatial data. We have been developing a virtual reality application of a 3D exploded star, for example, where each element detected would create its own sound as you walked through the stellar debris field.
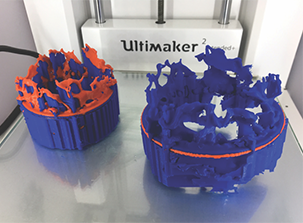
3D print of Supernova 1987A
Q: What led you to initiate this soundscape project?
A: The pandemic. Prior to the pandemic, my team and I had focused on working with communities using 3D printed kits of data of cosmic objects that we had refined with students from the National Federation of the Blind Summer Youthslam program. But during the pandemic, physical contact became extremely problematic, and my student XR program also had to be put on hold temporarily. I reached out to Matt Russo to see if we could create some 2D soundscapes of the high-energy Universe instead, as another way to keep working with our communities. It has been an incredibly rewarding project so far. Matt and his fantastic colleague Andrew Santaguida have a particular gift in approaching our Chandra data with not only a scientific lens, but an artistic lens as well, and we have created some excellent outputs from the sonification project overall.
Q: How effective are these sonifications in sharing these astronomical objects with those who are blind or low vision?
A: The sonifications are tested and verified with experts and non-experts who are blind or low vision (e.g., astrophysicist, amateur astronomer, students). Each sonification is created to best portray the scientific data in a way that makes the most sense for the specific data, keeping it accurately represented and telling the story, while also providing a new way of conveying meaning through sound.
Q: There are many different techniques that have been used in the sonifications. How do you decide which one or ones to use?
A: A one-size-fits-all approach to the sonification has not been helpful in this project to date (though we have also developed a simple sonification app with my students as a secondary approach to conveying meaning through sound). To help support and explain that individualistic approach, we create a description for each sonification (with a great team of BVI experts including J.J. Hunt and Christine Malec) to help provide the listener a 'road map' of the sounds. Such mental maps can be incredibly helpful to people who are blind or low vision. That map or description is also translated into audio files and visual descriptions with the release for BVI audiences and attached to the files as metadata, etc.
Q: How do you know if a sonification has been "successful"?
A: Success can be measured in many different ways, so I don't know that I can say with any certainty what others' views of success are. However, from user testing of the sonifications with different audiences (from students to adults who are blind or low vision), the response has been overwhelmingly positive. Indeed, emotion-inducingly positive. I also ran a research study, which is still being prepared for publication, to test the differences between BVI and non-BVI users. In preliminary analysis of the data, both groups demonstrated high learning gains, enjoyment and wanting to know and learn more and — interestingly enough — strong emotional responses to the data. Statistically, users who are blind or low vision showed higher levels of engagement than non-BVI, while non-BVI users demonstrated that they also learned about how others (e.g. users who are BVI) accessed data more generally. None of the above is complete, of course, as we're still learning and reflecting and creating as we go.
Q: What's next for this project or others related to it?
A: We have been investigating new techniques of sonification for the soundscapes. My students have been creating an app of a simple sonification and haptification (vibration-based tactile outputs) technique to apply to any astronomical data, and we are working to return to the spatially-aware sonified data XR app….and I have a paper to write on the results of the research survey!
There has been so much positive feedback. We definitely hope to keep continuing to work on applying more universal design to our astronomical data overall. How can we not? We're excited to play a part in making the Universe accessible to as many people as possible.
- Milky Way Galaxy Galactic Center
- Cassiopeia A
- M16/"Pillars of Creation"
- Bullet Cluster
- Crab Nebula
- Supernova 1987A
- Chandra Deep Field South
- Cat's Eye Nebula
- Messier 51 (Whirlpool Galaxy, M51)
- Westerlund 2
- Tycho's Supernova Remnant
- Messier 87 (M87)