Featured Resources
Classroom-Ready Activities
Science Olympiad Webinar
Science Olympiad JS9 Guide
Space Math @ NASA
NSO Tests 2025
- GullSO Test & Key
- Boyceville Test & Key
- RFTS UTX Invitational Test
- UTX Astro Invitational
- UTX Astro Walkthrough
Informal Education
Background
Interactive Games
Space Scoop
STOP for Science
Chandra Podcasts
Printable Materials
Resource Request
Educators' Comments
Evaluation Form
Education Collaborations
Passport to Knowledge
Space Place
Web Shortcuts
Chandra Blog
RSS Feed
Chronicle
Email Newsletter
News & Noteworthy
Image Use Policy
Questions & Answers
Glossary of Terms
Download Guide
Get Adobe Reader
Variable Stars in Cygnus: Plotting Magnitudes

You are now ready to estimate the changing magnitude of an actual variable star. Print the page to plot your magnitude estimations on the graph provided. Place the transparency over each one of the seven Field Slides of W Cyg and record your estimated magnitudes directly onto the graph above the corresponding Julian Day (JD).

Study the resulting light curve. What are the maximum and minimum magnitudes for W Cyg? How many cycles are represented? Can you determine the period? Is this a Cepheid variable star?


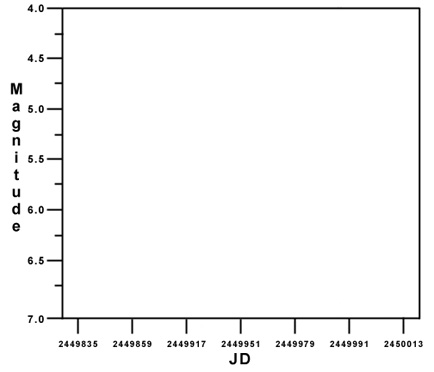
plot light curve

Return to Variable Stars Index