Astronomers Dig Out Buried Black Holes With NASA's Chandra
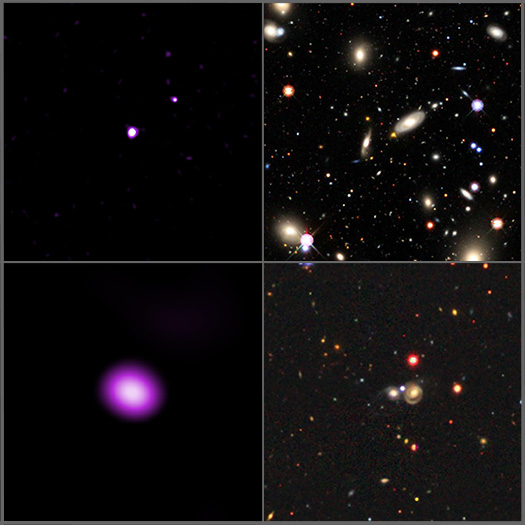
SDSS J011522.18+001518.5 and SDSS J155627.74+241758.9
Credit: X-ray: NASA/CXC/SAO/D. Kim et al.; Optical/IR: Legacy Surveys/D. Lang (Perimeter Institute)
This panel of images represents a survey that used data from NASA’s Chandra X-ray Observatory to uncover hundreds of previously “hidden” black holes. This result helps astronomers conduct a more accurate census of supermassive black holes that exist in the centers of most large galaxies, as reported in our latest press release.
This graphic shows two of the galaxies from the new study, with Chandra X-ray data in purple and optical data from the Sloan Digital Sky Survey (SDSS) in red, green and blue. These black holes were found in galaxies that are dim in optical light, but bright in X-rays. Astronomers have dubbed these “XBONGs” (for X-ray bright, optically normal galaxies). While scientists have been aware of XBONGs for several decades, an explanation for their unusual properties has been unclear.
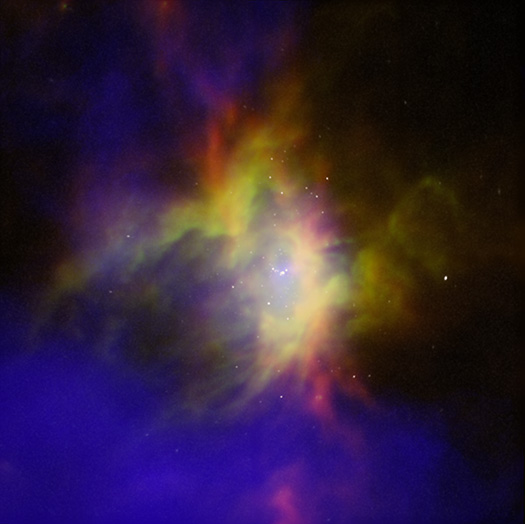
The Enduring Stellar Lifecycle in 30 Doradus

30 Doradus
Credit: X-ray: NASA/CXC/Penn State Univ./L. Townsley et al.; IR: NASA/ESA/CSA/STScI/JWST ERO Production Team
The largest and brightest region of star formation in the Local Group of galaxies, including the Milky Way, is called 30 Doradus (or, informally, the Tarantula Nebula). Located in the Large Magellanic Cloud, a small neighbor galaxy to the Milky Way, 30 Doradus has long been studied by astronomers who want to better understand how stars like the Sun are born and evolve.
NASA’s Chandra X-ray Observatory has frequently looked at 30 Doradus over the lifetime of the mission, often under the direction of Dr. Leisa Townsley who passed away in the summer of 2022. These data will continue to be collected and analyzed, providing opportunities for scientists both now and in the future to learn more about star formation and its related processes.
This new composite image combines the X-ray data from Chandra observations of 30 Doradus with an infrared image from NASA’s James Webb Space Telescope that was released in the fall of 2022. The X-rays (royal blue and purple) reveal gas that has been heated to millions of degrees by shock waves — similar to sonic booms from airplanes — generated by the winds from massive stars. The Chandra data also identify the remains of supernova explosions, which will ultimately send important elements such as oxygen and carbon into space where they will become part of the next generation of stars.
The Enduring and Engaging Legacy of Leisa Townsley
Credit: NASA/CXC/Leisa Townsley
When Dr. Leisa Townsley passed away this summer, the scientific community lost a brilliant researcher, teacher, and mentor. She was all of those things, but we wanted to feature some of the pivotal and critical ways that she helped the Chandra X-ray Observatory, specifically our Communications and Public Engagement work.
Chandra was launched into space in 1999 and with the beginning of its successful operations, a new era in high-energy astrophysics was born. For certain deep space objects that emitted enough X-ray photons, Chandra brought, for the first time, the ability to create richly detailed, high-resolution images. These X-ray images, however, were different in many ways from the images of its previously-launched sister Great Observatory, the Hubble Space Telescope.
Establishing a visual identity for Chandra, both on its own and in collaboration with other telescopes that study different kinds of light, including Hubble, was no small challenge. Our Chandra group was responsible for finding the best way to show X-ray data, which often looks completely different from optical data. Would traditional techniques used for visible light data be suitable to process X-ray data? Would new processes and tactics need to be developed to make X-ray data more accessible, easier to understand and process?
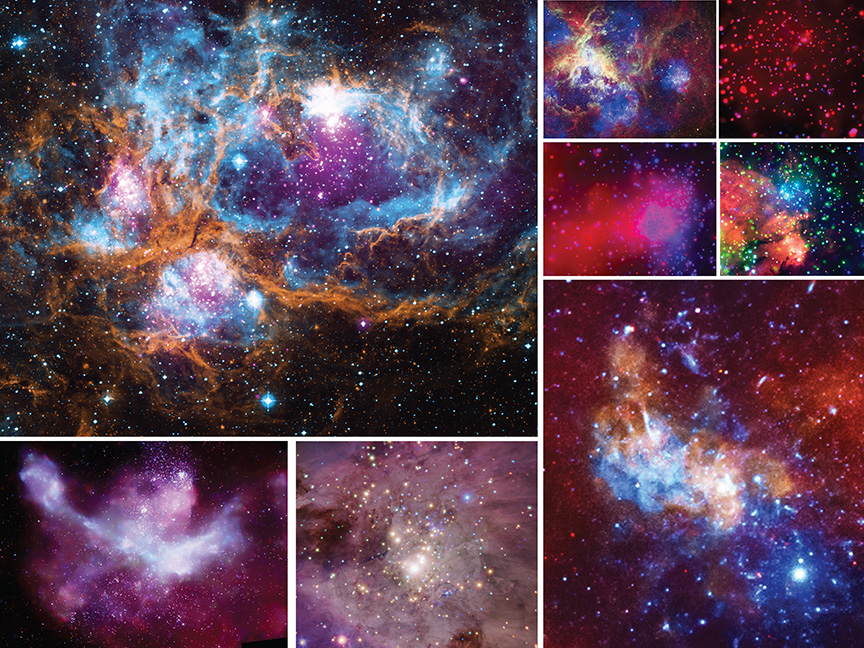
Chandra Sees Stellar X-rays Exceeding Safety Limits
NGC 3293
Credit: X-ray: NASA/CXC/Penn State Univ./K. Getman et al.; Infrared: ESA/NASA JPL-Caltech/Herschel Space Observatory/JPL/IPAC; NASA JPL-Caltech/SSC/Spitzer Space Telescope; Optical: MPG/ESO/G. Beccari;
Astronomers have made the most extensive study yet of how magnetically active stars are when they are young. This gives scientists a window into how X-rays from stars like the Sun, but billions of years younger, could partially or completely evaporate the atmospheres of planets orbiting them.
Many stars begin their lives in “open clusters,” loosely packed groups of stars with up to a few thousand members, all formed roughly at the same time. This makes open clusters valuable for astronomers investigating the evolution of stars and planets, because they allow the study of many stars of similar ages forged in the same environment.
A team of astronomers led by Konstantin Getman of Penn State University studied a sample of over 6,000 stars in 10 different open clusters with ages between 7 million and 25 million years. One of the goals of this study was to learn how the magnetic activity levels of stars like our Sun change during the first tens of millions of years after they form. Getman and his colleagues used NASA’s Chandra X-ray Observatory for this study because stars that have more activity linked to magnetic fields are brighter in X-rays.
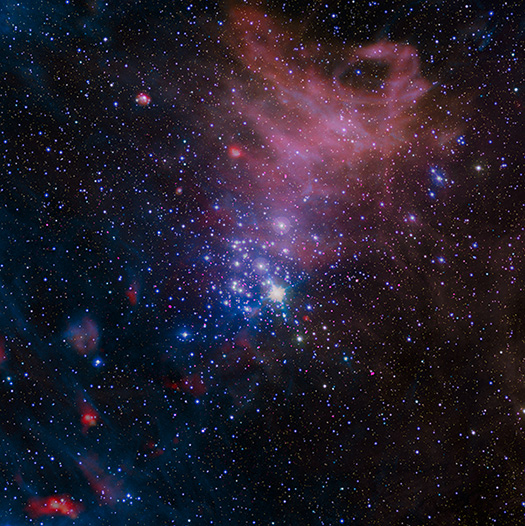
Astronomers See Stellar Self-Control in Action
RCW 36
Credit: X-ray: NASA/CXC/Ames Research Center/L. Bonne et al.; Infrared: ESA/NASA.JPL-Caltech/Herschel Space Observatory/JPL/IPAC
Many factors can limit the size of a group, including external ones that members have no control over. Astronomers have found that groups of stars in certain environments, however, can regulate themselves.
A new study has revealed stars in a cluster having “self-control,” meaning that they allow only a limited number of stars to grow before the biggest and brightest members expel most of the gas from the system. This process should drastically slow down the birth of new stars, which would better align with astronomers’ predictions for how quickly stars form in clusters.
This study combines data from several telescopes including NASA's Chandra X-ray Observatory, NASA's now-retired Stratospheric Observatory for Infrared Astronomy (SOFIA), the APEX (the Atacama Pathfinder EXperiment) telescope, and ESA’s (European Space Agency’s) retired Herschel telescope.
'Listen' to the Light Echoes From a Black Hole
Your browser does not support the video tag.
Credit: X-ray: Chandra: NASA/CXC/U.Wisc-Madison/S. Heinz et al.;
Swift: NASA/Swift/Univ. of Leicester/A. Beardmore;
Optical/IR: PanSTARRS; Sonification: NASA/CXC/SAO/K.Arcand,
SYSTEM Sounds (M. Russo, A. Santaguida)
One of the surprising features of black holes is that although light (such as radio, visible, and X-rays) cannot escape from them, surrounding material can produce intense bursts of electromagnetic radiation. As they travel outward, these blasts of light can bounce off clouds of gas and dust in space, similar to how light beams from a car’s headlight will scatter off fog.
A new sonification turns these “light echoes” from the black hole called V404 Cygni into sound. Located about 7,800 light-years from Earth, V404 Cygni is a system that contains a black hole, with a mass between five and 10 times the Sun’s, that is pulling material from a companion star in orbit around it. The material is funneled into a disk that encircles the stellar-mass black hole.
Planets Can Be Anti-Aging Formula for Stars

An artist’s illustration shows a gas giant planet (lower right) closely orbiting its host star (left), with another star in the distance (upper right). The two stars are themselves in orbit with each other. As explained in our latest press release, a team of scientists used NASA’s Chandra X-ray Observatory and ESA’s XMM-Newton to test whether such exoplanets (known as “hot Jupiters”) affect their host star in comparison to the star that does not have one. The results show that these exoplanets can make their host star act younger than it is by causing the star to spin more quickly than it would without such a planet.
The double-star (or “binary”) system in the illustration is one of dozens that astronomers studied using Chandra and XMM-Newton to look for the effects of hot Jupiters on their host stars. A hot Jupiter can potentially influence its host star by tidal forces, causing the star to spin more quickly than if it did not have such a planet. This more rapid rotation can make the host star more active and produce more X-rays, making it appear younger than it really is.
NASA's IXPE Helps Unlock the Secrets of Famous Exploded Star
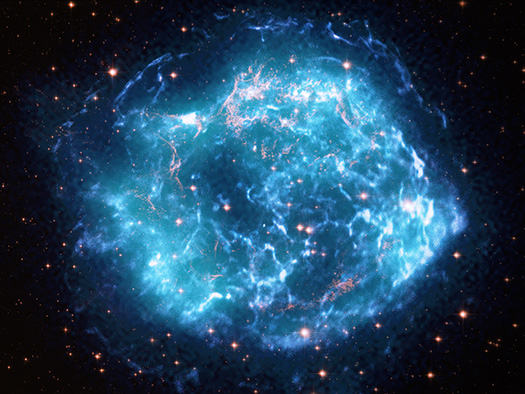
Cassiopeia A
Credit: X-ray: Chandra: NASA/CXC/SAO, IXPE: NASA/MSFC/J. Vink et al.; Optical: NASA/STScI
For the first time, astronomers have measured and mapped polarized X-rays from the remains of an exploded star, using NASA’s Imaging X-ray Polarimetry Explorer (IXPE). The findings, which come from observations of a stellar remnant called Cassiopeia A, shed new light on the nature of young supernova remnants, which accelerate particles close to the speed of light.
Launched on Dec. 9, 2021, IXPE, a collaboration between NASA and the Italian Space Agency, is the first satellite that can measure the polarization of X-ray light with this level of sensitivity and clarity.
All forms of light — from radio waves to gamma rays — can be polarized. Unlike the polarized sunglasses we use to cut the glare from sunlight bouncing off a wet road or windshield, IXPE’s detectors maps the tracks of incoming X-ray light. Scientists can use these individual track records to figure out the polarization, which tells the story of what the X-rays went through.
Cassiopeia A (Cas A for short) was the first object IXPE observed after it began collecting data. One of the reasons Cas A was selected is that its shock waves — like a sonic boom generated by a jet — are some of the fastest in the Milky Way. The shock waves were generated by the supernova explosion that destroyed a massive star after it collapsed. Light from the blast swept past Earth more than three hundred years ago.
NASA's Chandra Finds Galaxy Cluster Collision on a "WHIM"
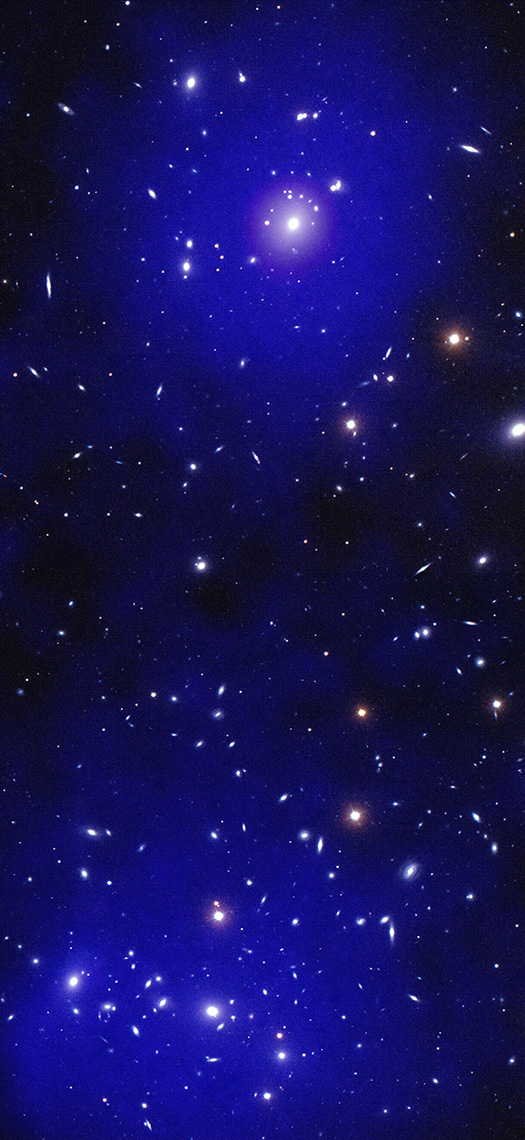
Credit: X-ray: NASA/CXC/CfA/A. Sarkar; Optical: NSF/NOIRLab/WIYN
This image features Abell 98, a system of galaxy clusters that includes a pair in the early stages of a collision. Astronomers have used data from NASA’s Chandra X-ray Observatory (shown as blue and purple with optical data from the WIYN telescope on Kitt Peak in Arizona appearing white and red) to identify key structures and look for “missing” matter in the Universe.
Chandra Adds X-ray Vision to Webb Images
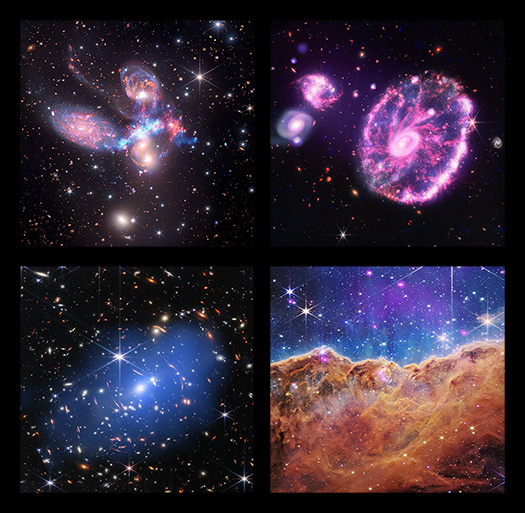
[Upper Left] Stephan's Quintet, [Upper Right] Cartwheel Galaxy,
[Lower Left] SMACS 0723, [Lower Right] The Cosmic Cliffs of the Carina Nebula (NGC 3324)
Credit: X-ray: NASA/CXC/SAO; IR (Spitzer): NASA/JPL-Caltech; IR (Webb): NASA/ESA/CSA/STScI
In the summer of 2022, NASA's James Webb Space Telescope released images from some of its earliest observations with the newly commissioned telescope. Almost instantaneously, these stunning images landed everywhere from the front pages of news outlets to larger-than-life displays in Times Square.
Webb, however, will not pursue its exploration of the universe on its own. It is designed to work in concert with NASA's many other telescopes as well as facilities both in space and on the ground. These new versions of Webb’s first images combine its infrared data with X-rays collected by NASA’s Chandra X-ray Observatory, underscoring how the power of any of these telescopes is only enhanced when joined with others.