An overview of the Chandra mission and goals, Chandra's namesake, top 10 facts.
Classroom activities, printable materials, interactive games & more.
Overview of X-ray Astronomy and X-ray sources: black holes to galaxy clusters.
All Chandra images released to the public listed by date & by category
Current Chandra press releases, status reports, interviews & biographies.
A collection of multimedia, illustrations & animations, a glossary, FAQ & more.
A collection of illustrations, animations and video.
Chandra discoveries in an audio/video format.
Return to Main Site

Disclaimer: This material is being kept online for historical purposes. Though accurate at the time of publication, it is no longer being updated. The page may contain broken links or outdated information, and parts may not function in current web browsers. Visit chandra.si.edu for current information.

A River Of Data Flows Through The CIAO Waterworks

December 19, 2001 ::
Pont du Gard
Pont du Gard near Nîmes in southern France
As previously explored by the Chandra Chronicles, getting the river of data from the Chandra Observatory to scientists is a complex process. But guiding and converting this data river of 1s and 0s is only the first step in the process of doing science with Chandra. What is the next step? The answer: The data torrent that flows from Chandra must be put through the mechanisms of a software waterworks.

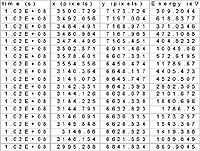
While processed Chandra data that is delivered to scientists is indeed more friendly than raw binary numbers, it is generally in a tabular form that requires still further manipulation. For example, here is a sample of what part of one Chandra dataset table looks like (Table 1).


Chandra data set file
Table 1: A sample portion of a Chandra dataset file.
This table contains the time, position, and energy record of every photon that was collected by Chandra during the course of observing an astronomical source. This numeric tabular data is indeed more interesting than a list of 1s and 0s, but what exactly can be seen and learned from it? Researchers need to be able to further process this so-called photon "event table" into other more useful data products such as images, spectra, and lightcurves. That is, Chandra's data tables need to be converted into other data products that both scientists and admirers can more easily appreciate.

In keeping with the flowing water analogy, additional processing of Chandra's data river is akin to putting water through one side of a dam, and using it for irrigation and turbines on the other side of the dam: both irrigation and energy resources originated from the same water, but each fulfills a different purpose.

Likewise, the images, spectra, and lightcurves created from Chandra's river of data can serve different science functions for an observed astronomical source, such as: showing its spatial size and structure, exploring how its light is composed of different wavelengths, and examining how its brightness varies with time. Answering these types of questions is what Chandra data analysis is all about. But, how does one get all that from this single table of data!?

One way to get all that information and more, is to take the next step and further process Chandra's tabular data using CIAO (Chandra Interactive Analysis of Observations), a software package specially developed by the Chandra X-ray Observatory Center (CXC) for analyzing Chandra data. This is Chandra's waterworks dam for its data river, so to speak.

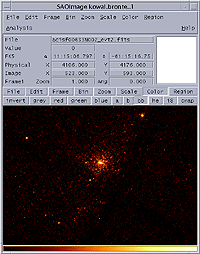
For example, CIAO provides an application for easily processing a Chandra event table like the one above into an image, all with a single click of the mouse!


FirstLook Application
Right: A Chandra image of the star cluster NGC3603, created by clicking the image icon in CIAO's FirstLook application. (shown above)
NGC 3603


So how did CIAO create an image from the table of data? Each row in the event table contains the position of a photon that struck Chandra's detector during the observation. CIAO simply plotted the positions of all these photons:

1. First, the X-axis position of a photon event is found.

ciao data

X-axis position
2. Then, the Y-axis position of this same photon event is found, and the event is added to the image:

ciao data

Y-axis


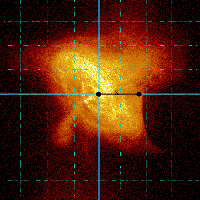
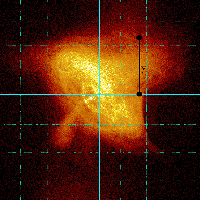
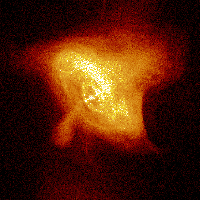
3. Multiple photon events occurred where the source was brighter, and CIAO reflects this in the color scheme of the final image (Image 1, below).
Crab Nebula
Image 1: A Chandra image of the Crab Nebula, a supernova remnant and pulsar.


Now that CIAO has processed it into an image, anyone can appreciate this dataset!

Of course, CIAO can do much more with Chandra's tabular data than just create images. For example, CIAO provides tools to generate spectra, which allow scientists to determine, among other things, what elements are present in a hot gas. Also, CIAO enables users to: filter data by energy bands, select out image portions, detect unknown sources, and track time variation in the intensity of X-ray sources.

To perform these tasks, a CIAO software user typically types a command. For example, the following CIAO command will use the CIAO tool called "dmcopy" to create an image that includes only a small region of the original image:


Cas A
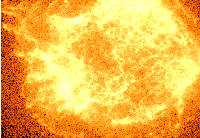
A Chandra image of
the supernova remanant Cas A.
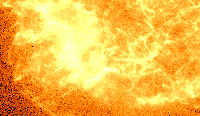
subset of the image Cas A
A subset of the Cas A image.


Similarly, to filter by energy as well as by region, the following CIAO command will also create an image of this region, but will include only those photons recorded in the table as having an energy between 2 and 8 keV (where keV is a unit used to describe the energy of X-rays):


And in the same way, another subset image can be made having different energies, between 0.3 and 1 keV.


subset of the Cas A image
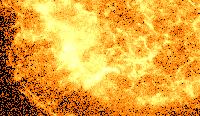
A subset of the Cas A image, including only photons having energy between 2 and 8 keV.
subset of the Cas A image
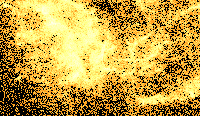
A subset of the Cas A image, including only photons having energy between 0.3 and 1 keV.


By comparing the differences between these two subset images that were produced by CIAO, scientists can begin to work toward possible scientific discovery.

Consisting of a suite of well over eighty data analysis tools, CIAO is an extensive software package. Chandra scientists must become familiar with what all these different CIAO tools can do. In addition to learning how to use individual CIAO tools, many Chandra data analysis tasks require users to employ multiple CIAO tools in a sequence. Usage of such a CIAO tool sequence, or "thread," will work step by step toward creating a specific final data product that will facilitate further scientific analysis. And, users must learn how to "speak CIAO" in order to properly compose valid CIAO commands such as the examples given above, which the software will be able to understand.

CIAO Workshop
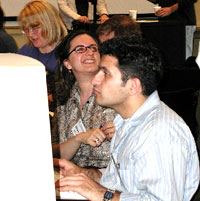
Scientists at a recent CIAO Workshop
in Cambridge, MA.
(Photo: CXC)
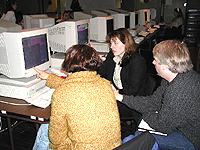
With so many CIAO tools, well over fifty common analysis threads, and a CIAO command language to learn, Chandra scientists have quite a data waterworks at their disposal! In order to assist scientists with learning CIAO, the CXC has hosted workshops at the Center for Astrophysics in Cambridge, MA. The most recent workshop was held in November 2001, during which a group of about twenty assembled for three days to hear talks about Chandra data and analysis, and to spend time at computers trying out the CIAO software.

Workshops were also given this past January and April 2001, with scientists traveling from all over the world to attend. While CIAO is packaged with documentation and help systems, many scientists have found these workshops useful learning experiences:

"I learned so much from the workshop! Although it was my first time dealing with X-ray data reduction, I feel comfortable diving into it myself after the CIAO workshop. Thank you so much for such an excellent workshop,"

"The workshop was very useful, especially the hand-on sessions with many people to ask around. No documents can replace that."


CIAO Workshop
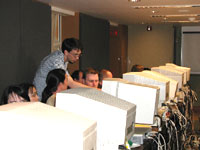
Lots of computers for hands-on trials of CIAO, at a recent CIAO Workshop.
(Photo: CXC)
CIAO Workshop
A group of scientists discuss Chandra data, at a recent CIAO Workshop.
(Photo: CXC)


It is the CXC's hope that the workshops aid scientists with their Chandra research, and provide them with the ability to take full advantage of CIAO's many capabilities.

Getting the river of data from Chandra to scientists is just the beginning of the process of doing science with Chandra. The CXC's CIAO software package is the sophisticated waterworks that enables scientists to extract exciting science from Chandra's rich datasets.

Be sure to check out Chandra's Press Room to read about the latest Chandra discovery!

If you're interested in learning a lot more about Chandra data and analysis, thorough information written for Chandra scientists is freely available from these CXC web resources:

Many thanks to special Chronicles Contributor Holly Jessop

More images from the November, 2001 CIAO Workshop
Subscribe to the Chandra Chronicles
Receive updates by email GO
Info & Privacy Policy.
Chronicles Archives
Articles from:
['15 | '14 | '13 | '12 | '11 | '10 | '09 | '08 |
'07 | '06 | '05 | '04 | '03 | '02 | '01 | '00 |
'99]
Recent Articles
Chandra Twitter Updates
    Follow Chandra on Twitter

    Disclaimer: This material is being kept online for historical purposes. Though accurate at the time of publication, it is no longer being updated. The page may contain broken links or outdated information, and parts may not function in current web browsers. Visit chandra.si.edu for current information.

    Return to Main Site

    Subscribe