

CXC Home | Search | Help | Image Use Policy | Latest Images | Privacy | Accessibility | Glossary | Q&A

Most of us are introduced to the term "color" when we are children. It invokes thoughts of creativity, originality, and expression. "Color" also has meaning in the realm of science. The spectrum of light that we can detect with the human eye can be broken into various colors from red to green to violet.
In astronomy, these "colors" can be extended far beyond the range we can see. Through telescopes and detectors, we can "see" from radio waves to X-rays and everything in between.
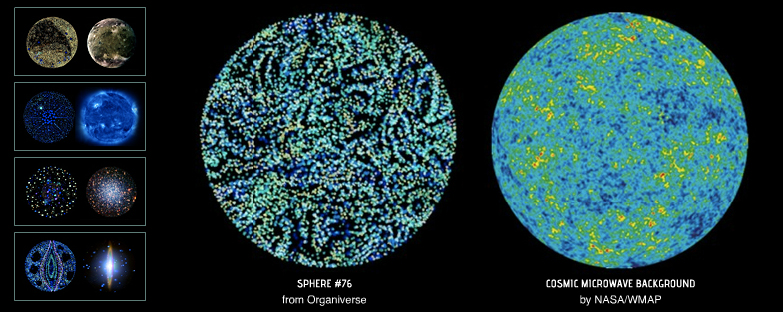
This piece is intended to provoke thought about how the two realms of color – in art and in space – intersect and diverge. It explores the similarities of how these different types of images are made, as well as discusses the ways in which they differ. We invite you to explore these images and what they represent both on their own and when presented as a comparison (or contrast?) to another in a separate field.
ORGANIVERSE by Henri van Bentum, b. Netherlands, August 13, 1929
Organiverse was created in 1972 while the artist Henri van Bentum was in residence in Morocco. Organiverse, done in pointillism, was finished on the island of Madeira that same year. The complete Organiverse portfolio consists of 100 spherical drawings that are each 8 ½ cm in diameter. These original mandalas were digitized using high quality HP imaging technology. Henri van Bentum is a painter and colorist currently based in Victoria, British Columbia. He works in oil, acrylic, watercolor, watercolor pencil and Chinese ink. Organiverse is copyrighted by Henri van Bentum and used here with permission.
Statement by the artist:
"I see myself as a 'magician' of the senses, a catalyst. My work unveils new worlds of pictorial imagery and meaning. By conscious action, I judge and complete what flows forth from intuition. The viewer may give free rein to his or her own imagination. Depending on life experiences and mental make-up, you will see micro-organisms, outer space, marine life forms or fantasy mindscapes. All these have a language of their own. Science, art and the human family meet and become one."
Excerpt, written by Henri van Bentum in 1964 for his solo exhibition in Toronto, "The Invisible Made Visible"
French painter Georges Seurat (1859 - 1891) is credited with the development of the Pointillism technique with his "Sunday Afternoon on the Island of La Grande Jatte" completed in 1886. Seurat studied color theory and optics. He then used his knowledge of science to develop the technique of Pointillism, where tiny dots of color are intentionally grouped by the artist to interact and be combined by the eye of the viewer. Pointillism formed out of Impressionism, a 19th-century art movement in which aspects of light were of primary concern to the artists. Impressionist artists (Monet, Cezanne, etc.) were originally considered radical, breaking the rules of more traditional and academic painting by giving color a higher importance than line.
SPACE IMAGES by NASA, 1998-2008FALSE COLOR
When a satellite observes an object in space, its camera records photons. These photons come down from the spacecraft in the form of 1's and 0's. Scientific software then translates that data into an event table that contains the time, energy and position of each photon that struck the detector during the observation. The data is further processed with software to form the visual representation of the object.
The term "false color" is often used to describe astronomy images whose colors represent measured intensities outside the visible portion of the electromagnetic spectrum (see illustration below). A false color image is not wrong or fake - it's a selection of colors chosen to represent a characteristic of the image (intensity, energy or chemical composition). The colors used are representative of the physical processes underlying the objects in the image.
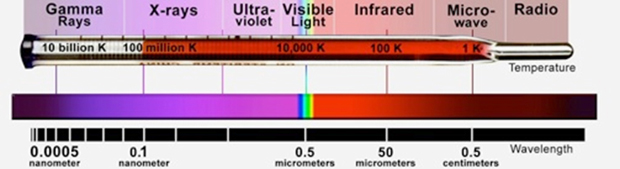
Illustration of the Electromagnetic Spectrum, includes wavelengths and energies from radio to gamma rays. Credit: NASA/CXC
The science images in this collection include:
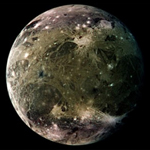
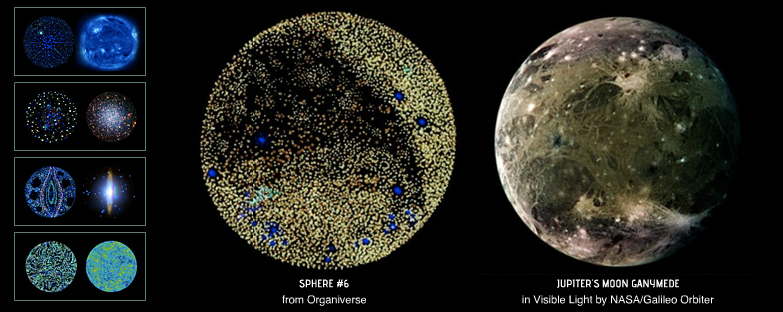
GANYMEDE in Visible Light by Galileo Orbiter
Ganymede, one of Jupiter's moons, is the largest satellite in the solar system with a diameter of 5,268 kilometers (3,270 miles). It is larger than Mercury and Pluto, and three-quarters the size of Mars. If Ganymede orbited the Sun instead of orbiting Jupiter, it would easily be classified as a planet. In this view of Ganymede the colors are enhanced to emphasize topographical differences. The enhancement reveals frosty polar caps in addition to the two predominant terrains on Ganymede, bright, grooved terrain and older, dark furrowed areas. Many craters with diameters up to several dozen kilometers are visible. The violet hues at the poles may be the result of small particles of frost which would scatter more light at shorter wavelengths (the violet end of the spectrum). This composite combines images taken with green, violet, and 1 micrometer filters. The images were taken March 1998 at a range of 918,000 kilometers (570,000 miles).
Scale: 5,268 kilometers (km) in diameter
Date: March 1998
Credit: NASA/JPL/DLR

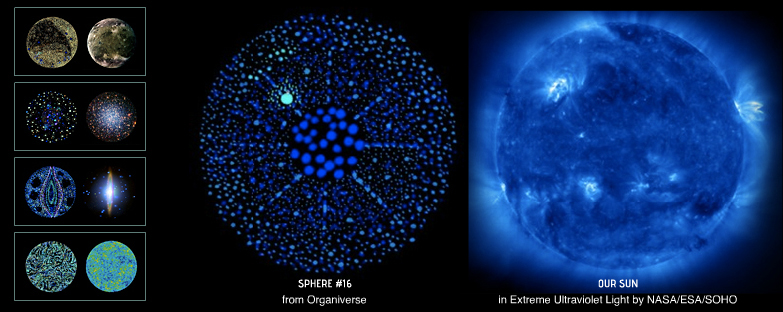
OUR SUN in Extreme Ultraviolet by Solar and Heliospheric Observatory (SOHO)
SOHO's Extreme ultraviolet Imaging Telescope images the solar atmosphere. This image captures curving erupting prominences from May 1998. Prominences are huge clouds of relatively cool dense plasma suspended in the Sun's hot, thin corona. At times, they can erupt, escaping the Sun's atmosphere. Every feature in the image traces magnetic field structure. The hottest areas appear almost white, while the darker blue areas indicate cooler temperatures. This image uses a blue intensity map.
Scale: 1,391,000 km in diameter
Date: May 1998
Credit: ESA/NASA/SOHO-EIT
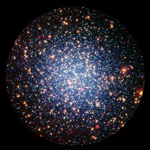
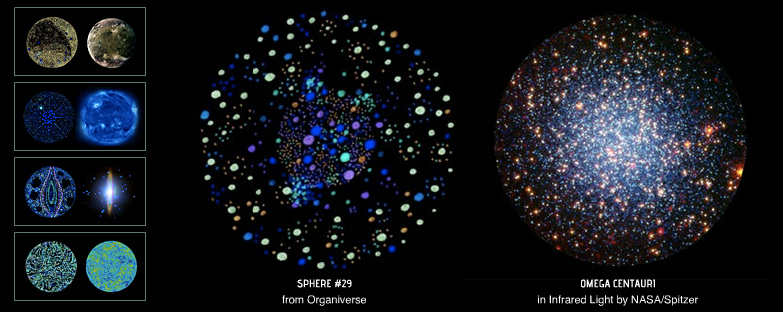
OMEGA CENTAURI in Infrared & Optical by Spitzer Space Telescope and Cerro Tololo Inter-American Observatory (CTIO)
Omega Centauri is a globular cluster "brimming with millions of stars that glistens like an iridescent opal." Located about 17,000 light years from Earth, Omega Centauri is the biggest and brightest of the 150 or so similar objects, called globular clusters, that orbit around the outside of our Milky Way galaxy. In this view of Omega Centauri, Spitzer's infrared observations have been combined with visible (optical) light data from the National Science Foundation's Blanco 4-meter telescope at CTIO in Chile. Optical light data is colored blue, 3.6-micron infrared light captured by Spitzer's infrared array camera is colored green and 24-micron infrared light taken by Spitzer's multi-band imaging photometer is colored red. Where green and red overlap, the color yellow appears. Thus, the yellow and red dots are stars revealed by Spitzer. These stars, called red giants, are more evolved, larger and dustier. The stars that appear blue were spotted in both visible and 3.6-micron-, or near-, infrared light. They are less evolved, like our own Sun. Some of the red spots in the picture are distant galaxies beyond our own.
Scale: 175 light years across (1 light year = 10 trillion km)
Date: April 2008
Credit: NASA/JPL-Caltech/M.Boyer (Univ. of Minnesota)
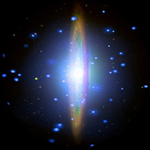
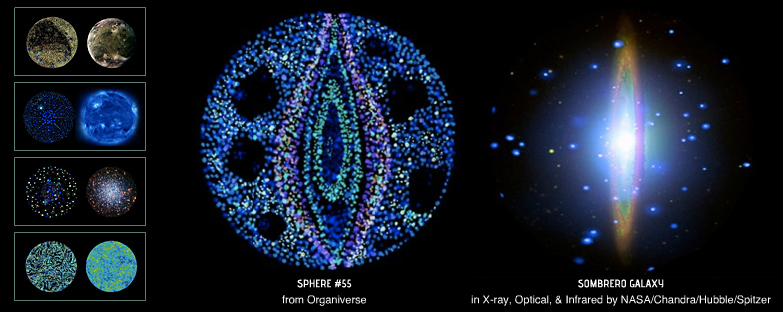
SOMBRERO GALAXY in X-ray, Optical & Infrared by Chandra, Hubble & Spitzer Space Telescopes
The Sombrero is a massive galaxy, equivalent in size to about 800 billion suns. The Chandra X-ray image (blue) shows hot gas in the galaxy and point sources that are a mixture of objects within the Sombrero as well as quasars in the background. Chandra observations show that diffuse X-ray emission extends over 60,000 light years from the center of the Sombrero. (The galaxy itself spans 50,000 light years across.) Scientists think this extended X-ray glow may be the result of a wind from the galaxy, primarily being driven by supernovas that have exploded within its bulge and disk. The Hubble optical image (green) shows a bulge of starlight partially blocked by a rim of dust, as this spiral galaxy is being observed edge on. That same rim of dust appears bright in Spitzer's infrared image (red), which also reveals Sombrero's central bulge of stars. This image has been rotated so that north is to the left.
Scale: 50,000 light years across
Date: X-rays observed May 2001, Optical observed May-June 2003, Infrared observed June 2004 & January 2005.
Credit: X-ray: NASA/UMass/Q.D.Wang et al.; Optical: NASA/STScI/AURA/Hubble Heritage; Infrared: NASA/JPL-Caltech/Univ. AZ/R.Kennicutt/SINGS Team
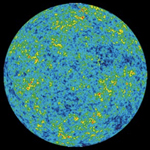
COSMIC MICROWAVE BACKGROUND by Wilkinson Microwave Anisotrop Probe (WMAP)
WMAP measures a remnant of the early universe - its oldest light. The conditions of the early times are imprinted on this light. It is the result of what happened earlier, and a backlight for the later development of the universe. This light lost energy as the universe expanded over 13.7 billion years, so WMAP now sees the light as microwaves. This image shows the cosmic microwave temperature fluctuations from 5 years of WMAP observations seen over the full sky map. The colors used in this image indicate "warmer" (red) and "cooler" (blue) spots of the infant universe.
Scale: The full sky
Date: Data taken from 2002-2007
Credit: NASA/WMAP Science Team
Related Projects:
Sight Lines: Looking Back, Seeing Through

Revised: September 09, 2019