
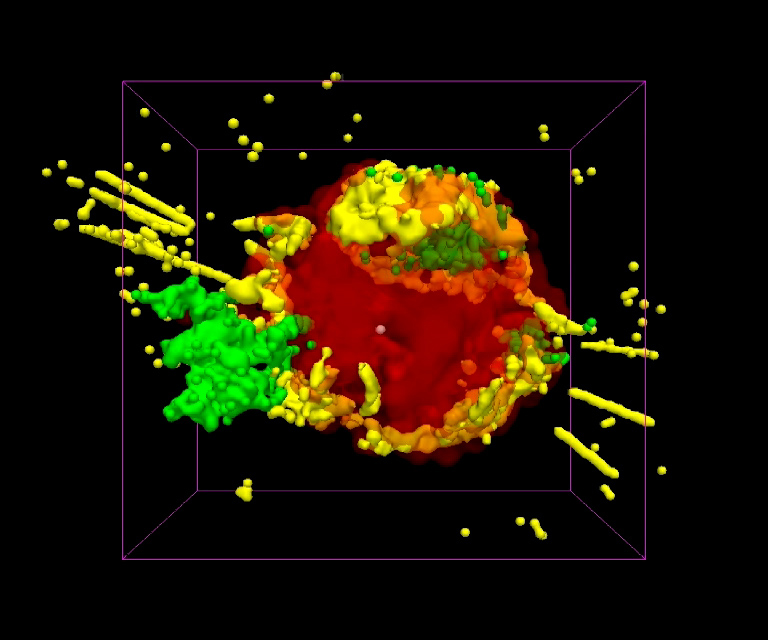
For the first time, a multiwavelength three-dimensional (3-D) reconstruction of a supernova remnant has been created. This stunning visualization of Cassiopeia A (Cas A), the result of an explosion approximately 330 years ago, uses X-ray data from Chandra, infrared data from Spitzer and pre-existing optical data from NOAO's 4-meter telescope at Kitt Peak and the Michigan-Dartmouth-MIT 2.4-meter telescope. In this visualization, the green region is mostly iron observed in X-rays. The yellow region is a combination of argon and silicon seen in X-rays, optical, and infrared - including jets of silicon - plus outer debris seen in the optical. The red region is cold debris seen in the infrared. Finally, the blue reveals the outer blast wave, most prominently detected in X-rays.
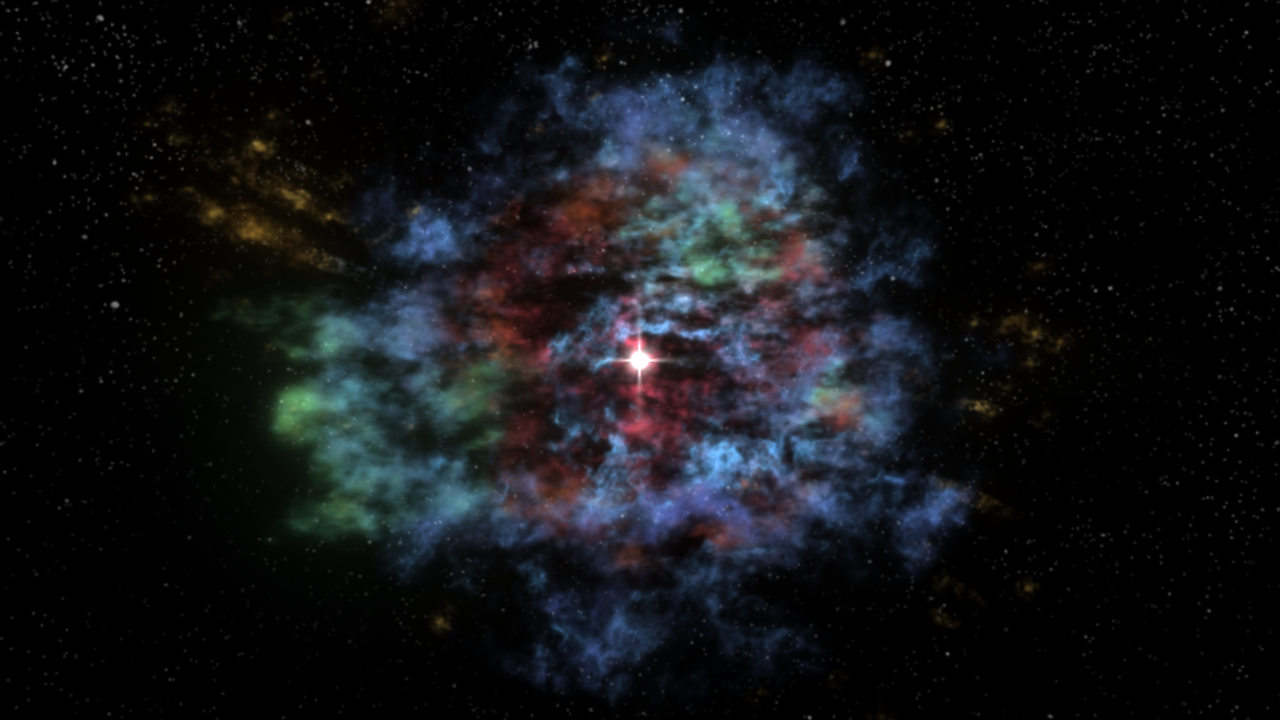
Most of the material shown in this visualization, which begins with an artist's rendition of the neutron star previously detected by Chandra, is debris from the explosion that has been heated by a shock moving inwards. The red material interior to the yellow/orange ring has not yet encountered the inward moving shock and so has not yet been heated. These unshocked debris were known to exist because they absorb background radio light, but they were only recently discovered in infrared emission with Spitzer. The blue region is composed of gas surrounding the explosion that was heated when it was struck by the outgoing blast wave, as clearly seen in Chandra images.
To create this visualization, scientists took advantage of both a previously known phenomenon - the Doppler effect - and a new technology that bridges astronomy and medicine. When elements created inside a supernova, such as iron, silicon and argon, are heated they emit light at certain wavelengths. Material moving towards the observer will have shorter wavelengths and material moving away will have longer wavelengths. Since the amount of the wavelength shift is related to the speed of motion, one can determine how fast the debris are moving in either direction. Because Cas A is the result of an explosion, the stellar debris are expanding radially outwards from the explosion center. Using simple geometry, the scientists were able to construct a 3-D model using all of this information. A program called 3-D Slicer - modified for astronomical use by the Astronomical Medicine Project at Harvard - was used to display and manipulate the 3-D model. Commercial software was then used to create the 3-D fly-through.
The blue filaments defining the blast wave were not mapped using the Doppler effect because they emit a different kind of light - synchrotron radiation - that does not emit light at discrete wavelengths, but rather in a broad continuum. The blue filaments are only a representation of the actual filaments observed at the blast wave.
This visualization shows that there are two main components to this supernova remnant: a spherical component in the outer parts of the remnant and a flattened (disk-like) component in the inner region. The spherical component consists of the outer layer of the star that exploded, probably made of helium and carbon. These layers drove a spherical blast wave into the diffuse gas surrounding the star. The flattened component - that astronomers were unable to map into 3-D prior to these Spitzer observations - consists of the inner layers of the star. It is made from various heavier elements, not all shown in the visualization, such as oxygen, neon, silicon, sulphur, argon and iron.
High-velocity plumes, or jets, of this material are shooting out from the explosion in the plane of the disk-like component mentioned above. Plumes of silicon appear in the northeast and southwest, while those of iron are seen in the southeast and north. These jets were already known and Doppler velocity measurements have been made for these structures, but their orientation and position with respect to the rest of the debris field had never been mapped before now.
This new insight into the structure of Cas A gained from this 3-D visualization is important for astronomers who build models of supernova explosions. Now, they must consider that the outer layers of the star come off spherically, but the inner layers come out more disk-like with high-velocity jets in multiple directions.
|
||||||||||||||||||||||||||||

Does the data give any indication as to the rotational speed of the Neutron star?
Posted by dale on Thursday, 07.25.13 @ 11:44am